Amusing: Another "hottest" year
If 27 HUNDREDTHS of one degree floats your boat, good luck. Your boat will still probably sink, however, when you note that it is only the fiddle-prone terrestrial measurements that show "hottest". All the satellite data show no such thing. The fact that neither NCDC, GISS nor JMA have acknowledged the disagreement with satellite data reeks of collusion and fraud. Not that there is anything new about that. The way the Warmists contantly act as if statistically insignificant differences of hundredths of a degree meant something is scientific dishonesty in itself.

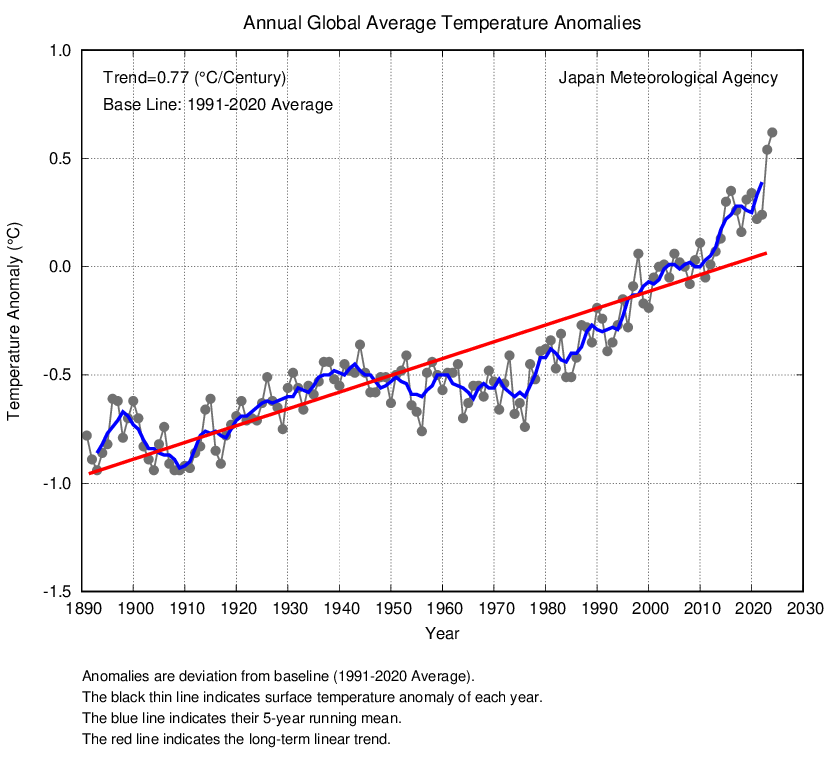
Graph from JMA. The differences in the the leaping line above are expressed in tenths of a degree. If the line were drawn in terms of whole degrees, it would be dead-flat horizontal. It is only the application of a statistical magnifying glass that makes it look as if something is going on
And here's some fun:

What's the difference between the two graphs? A great leaping line now looks very flat, does it not? Yet it is exactly the same graph from the same source, displaying the same information. I have just altered the html that dictates how it is displayed. And it now gives a picture closer to reality. It gives a better impression of how flat the temperatures have in fact been. Warmist graphs are essentially exercises in chartmanship -- how to lie with graphs. The figures on the graph are not the main problem. The problem is picturing tiny changes as huge -- using wide calibrations down the side of the graph.
The Japan Meteorological Association (JMA) has become the latest organisation to claim that 2014 was the hottest on record.
They say it was 0.27°C warmer than the average from 1981 to 2010, and 0.63°C warmer than the 20th century average - without the help of an El Niño weather event.
And according to their data, ten of the hottest years on record have come since 1998. And none of them differ from one another to a statistically significant degree
The JMA joins Nasa and the National Oceanic and Atmospheric Administration (Noaa) in the US, and the UK Met Office, as one of four major global temperature 'keepers' to reveal 2014 was the hottest ever.
All four make their readings separately to one another - and they have all individually come to the same conclusion that last year was the hottest since records began in the late 19th century.
Experts say the rate at which it is warming is alarmingly quick. What is quick about 7 tenths of a degree per CENTURY? (See the trend figure at the top of the graph)
According to the JMA, the average temperature last year was 0.27°C warmer than the average from 1981 to 2010, and 0.63°C warmer than the 20th Century average.
And it is by far the hottest year in 120 years of keeping records. Many records go back further than that -- the Central England dataset, for instance
The findings also reveal there has been no warming slowdown in the past decade, despite claims to the contrary by skeptics. No change in 18 years is not a slowdown? It's a dead halt!
Some believed there was a slowdown because of an abnormally extreme El Niño weather effect in 1998 which was the second hottest year on record.
As seen in the graph above, years after 1998 were seen to be cooler, leading some to suggest climate change had been slowing.
However, this data shows that, although cooler than 1998, the top ten hottest years on record all came in the last 16 years - showing there has been no climate slowdown. It shows nothing of the sort. It shows that temperatures have plateaued
Before 1998, no year came close to approaching these top ten in temperature. How close is close? Is two tenths of one degree not close?
Various organisations are preparing to release data, or have already, which shows that 2014 was the hottest year on record across the globe.
While some places, like the US, may have experienced a variation that caused some places to get very slightly colder, overall the global trend is a worrying increase, far faster than any natural phenomenon could cause. Absurd. The geological record shows previous rapid warming. And this isn't warming. It's stasis
It heavily suggests humans are driving climate change through the emissions of CO2. Stasis suggests warming?
More crap HERE
Posted by John J. Ray (M.A.; Ph.D.).
1 comment:
Thursday 8 January 2015 17.53 EST
America is colder than Mars. Some parts of it, anyway
According to data collected by the Curiosity Rover, the Gale crater is currently warmer than most of the northern US despite being 50m km farther from the Sun.
According to figures from Nasa, parts of the northern United States are currently experiencing temperatures considerably colder than those on Mars.
The high “air” temperature on Mars, according to the latest data from Nasa’s Curiosity Rover, occurring in the Gale crater near the Red Planet’s equator, hit a balmy daytime high of 17.6F (-8C).
http://www.theguardian.com/us-news/2015/jan/08/america-colder-than-mars-gale-crater
Post a Comment