Monday, February 29, 2016
Ho Hum! More Leftist nonsense about IQ
As with Leftists in general you have to look past what the author below says to what he doesn't say. It is true that tracking down a particular gene for any given type of behavior is in its infancy, though some progress has been made with IQ. But we don't need to know that. We can assess inheritance by twin studies. And for many years now we have found that identical twins reared apart are amazingly similar whereas non-identical twins reared apart can be quite different. And that shows how much we owe to our genes. In the case of IQ the twin studies indicate that about two thirds of it is inherited.
The author below, Oliver James, refers to Prof. Robert Plomin, a leading behaviour geneticist, but he totallly misrepresents what Plomin says. Plomin is a very active researcher and I read his papers frequently. He is the last person to deny genetic influences on behaviour. He studies them all the time. There is no point in listing his academic articles here but you can find here an article in which he discusses his research and conclusions. Believe Plomin on Plomin, not some Leftist nutter.
See also my recent comment on Plomin's work here. It gives the link to Plomin's own comprehensive study.
You would not guess it from Mr James's deceptions but there is in fact a steady stream of findings coming out all the time about IQ and its genetic base. I have collected my various posts over the last couple of years on the subject into a single blog, an IQ blog. I have done that mainly for my personal ease of reference but I think anybody browsing through the entries there will be amazed at the wide-ranging influence of IQ.
Mr James is just a liar. He says he had a difficult childhood. I believe it
When I was ten, my parents were informed by my headmaster that I was born stupid, and would have to move to a school for the congenitally defective.
To be fair, I was a badly behaved slacker who was always at or near the bottom of every class (the weekly beatings did not help). But the interesting thing is that it was not my genes that made me a thicko.
Although hardly anyone outside the world of science is aware of it, research in the past decade has proved for the first time that no one is made dim or bright by their genes, or for that matter, mad or sane.
It’s finally being established that your character and mentality is not in your genes. The age-old nature-nurture debate is over, and nurture has won.
Don’t take my word for it: Professor Robert Plomin, a behavioural geneticist at King’s College, London, one of the world’s leading experts in this field, said last year: ‘I’ve been looking for these genes for 15 years and I don’t have any.’
Or look at the huge 2013 study of the genes of twins, whose title told you all you need to know: ‘No genetic influence for childhood behaviour problems from DNA analysis’. Many other studies have had similar findings.
Yes, significant genes for differences in physical traits, like height or eye colour, have been identified by the international quest for genes known as the Human Genome Project.
But no genes that matter have been found for psychological traits.
SOURCE
Posted by John J. Ray (M.A.; Ph.D.).
Sunday, February 28, 2016
Bob "sea level" Kopp is at it again
As we saw recently, Bob is the "semi-empirical" man -- i.e. he guesses a lot. One of Australia's far Left webzines seems not to have picked that up. Their article below meekly accepts the assertions of Bob and his friends about coastal flooding in the USA. In my usual pesky way, however, I have had a look at the source article to see where the numbers come from. Below is what I found in the Executive Summary:
"Human-caused climate change is contributing to global sea level rise and consequently aggravating coastal floods. This analysis removes the assessed human-caused component in global sea level from hourly water level records since 1950 at 27 U.S. tide gauges, creating alternative histories simulating the absence of anthropogenic climate change. Out of 8,726 days when unaltered water level observations exceeded National Weather Service local “nuisance” flood thresholds for minor impacts, 5,809 days (3,517-7,332 days, >90% confidence interval) did not exceed thresholds in the alternative histories.So Bob was just guessing again. HOW did he "assess" the human-caused component in sea level rise? By the same "semi-empirical" methods he has used elsewhere. There is no way you can tease out a human component in sea level rise without using assumptions. And sea-level rise in recent years has been so slow that there is little likelihood that there is any human-caused component in it at all.
In other words, human-caused global sea level rise effectively tipped the balance, pushing high water events over the threshold, for about two-thirds of the observed flood days. The fraction has increased from less than half in the 1950s, to more than three-quarters within the last decade (2005-2014), as global sea level has continued to rise."
But the fun does not stop there. Bob says that the period 2005-2014 shows the human influence particularly strongly. WHICH human influence? There was no global warming at all during that period according to the satellites so the "influence" cannot be anything due to global warming.
Just another example of Warmist theory running away from the data
New research released this week has dusted down the “human fingerprints on thousands of recent floods”, and found that sea level rise was the cause of two thirds of American floods since 1950.
The study looked at 27 tidal gauges around the United States, and found that since mid-century nearly 6,000 ‘nuisance’ floods would not have happened if not for human-induced greenhouse gas emissions.
And as sea levels rise, things are only getting worse: Since 1950, there has been an unbroken upward trend in the number of flood days caused by anthropogenic climate change, according to the report published by American think-tank Climate Central.
Between 1955 and 1965, around 45 per cent flood events were attributed to climate change. In the decade to 2014 however, a staggering 76 per cent of floods were pushed over the levee by mankind.
The study drew its conclusions by taking estimates of how much sea-level rise humans have caused, and detracting that unnatural increase from the levels reached during a given flood event.
If the National Weather Service’s threshold for a ‘nuisance flood’ wouldn’t have been crossed without sea-level rise caused by unnatural emissions, it was found to have been ‘caused’ by climate change.
The floods in question don’t neccesarily cause major damage, but the report said they “do cause material harm, inconvenience and economic drag”.
SOURCE
Posted by John J. Ray (M.A.; Ph.D.).
Saturday, February 27, 2016
The causality of CO2 and global warming
I have no idea who Adolf Stips is but I wish him well. He seems to have something to do with the EU and is clearly a keen Warmist but I can find no other information about him. I suspect he is Belgian. You would have to be Belgian to call your kid Adolf these days. Anyway, he appears to believe that mathematical methods can detect causality, which is amusing. I reproduce below the abstract of an article under his authorship which makes that claim. It is an article that does seem to have attracted some attention, as one would expect.
During my student days I took three full-year courses in analytical philosophy, meaning that I did a "major" in that subject. And that bore fruit in that I had a few articles on analytical philosophy topics published in the academic journals, one of which was well received. And among those articles was included a look at the topic of causality: What is cause?
For present purposes, however, I will stick with the minimalist approach of David Hume to that topic -- who -- as is well known -- specified temporal priority and constant conjunction as the sole nature of causation.
But Stips and his merry men note that temperature rises used to cause CO2 rises but they "flipped" recently so that CO2 rises now cause temperature rises. To a Humean and, in fact, anyone with half a brain, that would indicate no causal connection between the two. Constant conjunction is shown but not invariant temporal priority. So Stips is talking nonsense. How sad!
In addition to the abstract I reproduce below an excerpt from a plain English summary of the work in Phys.org. I have verified the accuracy of the summary in the original article but the summary is easier to follow.
The whole point of the Stips effort is to address the well-known fact that, in paleoclimatological history, temperature rises preceded CO2 rises, which blows Warmist theory out of the water, which asserts the opposite. Warmists normally ignore that but Stips has bravely taken it on and attempted to circumvent it.
I have zero interest in unravelling Stips's mathematics in order to isolate where his faulty assumptions lie but that he does make faulty assumptions is obvious
On the causal structure between CO2 and global temperature
Adolf Stips, Diego Macias, Clare Coughlan, Elisa Garcia-Gorriz & X. San Liang
Abstract
We use a newly developed technique that is based on the information flow concept to investigate the causal structure between the global radiative forcing and the annual global mean surface temperature anomalies (GMTA) since 1850. Our study unambiguously shows one-way causality between the total Greenhouse Gases and GMTA. Specifically, it is confirmed that the former, especially CO2, are the main causal drivers of the recent warming. A significant but smaller information flow comes from aerosol direct and indirect forcing, and on short time periods, volcanic forcings. In contrast the causality contribution from natural forcings (solar irradiance and volcanic forcing) to the long term trend is not significant. The spatial explicit analysis reveals that the anthropogenic forcing fingerprint is significantly regionally varying in both hemispheres. On paleoclimate time scales, however, the cause-effect direction is reversed: temperature changes cause subsequent CO2/CH4 changes.
Scientific Reports 6, Article number: 21691 (2016) doi:10.1038/srep21691
An excerpt from the summary in Phys.org:
"The authors applied the same technique to analyse historical air temperatures and CO2/CH4 data from the past 800,000 years, available thanks to the 3,000 meter deep ice core drilled in Antarctica more than a decade ago, which offers scientists a clue on a time scale of 800 millennia. They found a causal relationship between temperature increase and rising CO2/CH4 levels, which is the exact opposite of the results for the last 150 years. This also confirms the validity of the technique, as it is well known from the ice core data that in historical times, increase of temperatures had been followed by higher CO2/CH4 emissions. The causality relationship appears to have started reversing around 5000 years ago. The analysis confirms this opposite trend for the last 150 years, when unprecedented amounts of CO2 started being pumped into the atmosphere in the industrial age"
Posted by John J. Ray (M.A.; Ph.D.).
Thursday, February 25, 2016
Warmists still have a capacity to surprise us
After the shoddy attempt by Tom Karl to "adjust" the warming "hiatus" out of existence, a brand new paper comes as a surprise. In it, some hard-core Warmist scientists REVIVE the hiatus. Perhaps they are scientists enough to conclude that they cannot just ignore the satellite data. Though they do not accept the complete plateau that the satellites indicate. They say that the temperature rise has slowed down to a crawl but there is still some warming going on.
The abstract is below. It is from a long narrative article which looks at possible explanations for the pause -- and they conclude that a serendipitious combination of natural factors has been cancelling out the influence of increased CO2 levels. But the argument is all very "post hoc" and vague. You can explain anything after the event but that is trivial. It's making accurate predictions that support a scientific theory -- and the authors admit that their predictions got it wrong. And a combination of many effects being needed to build the explanation just makes the explanation more and more implausible and less testable. It's just a last ditch effort to keep the show on the road.
Making sense of the early-2000s warming slowdown
By John C. Fyfe, Gerald A. Meehl, Matthew H. England, Michael E. Mann, Benjamin D. Santer, Gregory M. Flato, Ed Hawkins, Nathan P. Gillett,Shang-Ping Xie,Yu Kosaka & Neil C. Swart
Abstract
It has been claimed that the early-2000s global warming slowdown or hiatus, characterized by a reduced rate of global surface warming, has been overstated, lacks sound scientific basis, or is unsupported by observations. The evidence presented here contradicts these claims.
SOURCE
Posted by John J. Ray (M.A.; Ph.D.).
Wednesday, February 24, 2016
Some "Semi-empirical" findings! How lucky we are!
The report below determinedly revives all the old scare about sea-level rise. The scare has been pretty moribund for a few years now, thanks partly to some heavy hits on it by sea-level expert Nils Axel Morner.
The underlying academic journal article ("Temperature-driven global sea-level variability in the Common Era") is here and one of the authors, young Bob Kopp, has some useful details about it here.
The article was based on some very complex statistical work and in that context we note that the authors describe their work as "semi-empirical". What does that mean? It simply means that their results come partly from guesswork. And seeing the authors are keen Warmists we can be sure in which direction their guesses tended. And, with the complex nature of their analyses, guesses at various points could make a big difference to the final outcome. To believe their conclusions would therefore require an act of faith
And in my usual pesky way, I had a bit of a look at the details of the research. And I note that their methods produce some pretty weird results. They found, for instance, that sea levels FELL during the Medieval Warm Period. Isn't warming supposed to cause sea-level RISE? They try to get around that by reviving the old Warmist claim that the Medieval Warm Period was confined to Northern Europe -- but that is quite simply false. Evidence of it has been found in places as far apart as Argentina, New Zealand and China.
So have these guys simply lied in order to defend their research methods? Very nearly. Kopp says: "Notably, both the decline in sea level and the decline in temperature occurred during the so-called European “Medieval Warm Period,” providing additional evidence that the “Medieval Warm Period” and “Little Ice Age” were not globally synchronous phenomena."
So they say that the warming outside Europe occurred at different times to the warming elsewhere. And given the uncertainties of dating proxy data that is just barely defensible, if implausible. It's playing fast and loose with the facts but is not an outright lie.
But their finding that the globe actually COOLED during the Medieval Warm Period is contrary to all other evidence on the subject that I know of. You would have to have the faith of a Jehovah's Witness to believe their conclusions
Global sea levels rose faster in the 20th century than at any time in the past 3,000 years - and 'climate change is to blame'
Scientists discovered that the 5.5-inch (14cm) global rise is at least twice as much as would have been seen without global warming. In fact, they believe levels might have actually fallen if it hadn't been for soaring global temperatures.
During the 20th century, sea levels across the globe rose faster than in any of the 27 previous centuries. Scientists found that the 5.5-inch (14cm) global rise is at least twice as much as would have been seen without global warming. In fact, they believe levels may have fallen if it hadn't been for rising temperatures
During the 20th century, sea levels across the globe rose faster than in any of the 27 previous centuries. Scientists found that the 5.5-inch (14cm) global rise is at least twice as much as would have been seen without global warming. In fact, they believe levels may have fallen if it hadn't been for rising temperatures
'The 20th century rise was extraordinary in the context of the last three millennia - and the rise over the last two decades has been even faster,' said professor Robert Kopp, lead author of the report published in the Proceedings of the US National Academy of Sciences.
The pattern was revealed by a new statistical analysis technique which extracts global data from local records.
No local record measures global sea level. Instead, each measures sea level at a particular location, where it will differ from the global mean.
The statistical challenge is to pull out the global signal.
The scientists built a database of geological sea-level indicators from marshes, coral atolls and archaeological sites at 24 locations around the world, covering the past 3,000 years.
They also looked at tide gauge recordings for the last 300 years from 66 other locations.
Many of the records came from the field work of Kemp, Horton, or team members Roland Gehrels of the University of York and Jeffrey Donnelly of the Woods Hole Oceanographic Institution.
This information was used to calculate how temperatures relate to the rate of sea-level change. Using this new technique, the researchers showed that the world's sea level fell by about 11 inches (8cm) between 1000 and 1400AD, when the planet cooled by about 0.2°C.
Global average temperature today is about 1°C higher than at the end of the 19th century.
It also found that , had global warming not occurred in the 20th century, the change in sea level would 'very likely' have been between a decrease of 1.1 inch (3cm) and a rise of 2.8 inches (7cm). Instead, the world actually saw a rise of 14cm.
A companion report also found that more than half of the 8,000 coastal nuisance floods observed at US tide gauge sites since 1950 would not have occurred.
Professor Kopp estimates that sea levels will rise by 20 inches to 51 inches (50cm to 130cm) in the 21st century, if the world continues to rely on fossil fuels.
SOURCE
The journal abstract follows
We present the first, to our knowledge, estimate of global sea-level (GSL) change over the last ∼3,000 years that is based upon statistical synthesis of a global database of regional sea-level reconstructions. GSL varied by ∼±8 cm over the pre-Industrial Common Era, with a notable decline over 1000–1400 CE coinciding with ∼0.2 °C of global cooling. The 20th century rise was extremely likely faster than during any of the 27 previous centuries. Semiempirical modeling indicates that, without global warming, GSL in the 20th century very likely would have risen by between −3 cm and +7 cm, rather than the ∼14 cm observed. Semiempirical 21st century projections largely reconcile differences between Intergovernmental Panel on Climate Change projections and semiempirical models.
doi: 10.1073/pnas.1517056113. PNAS February 22, 2016
Morner rips the Keystone Kopp
Young Bob Kopp may not have furthered his career much by his evangelism for the rising sea-level gospel. Dr. Nils Axel Morner has some germane comments on his work below. Prior to his retirement, Morner headed the Department of Paleogeophysics & Geodynamics at Stockholm University
Morner, a leading world authority on sea levels and coastal erosion calls the new study and the media spin surrounding it “demagogic.”
“The PNAS paper is another sad contribution to the demagogic anti-science campaign for AGW. It is at odds with observational facts and ethical principles,” Morner wrote to Climate Depot.
Morner noted:
– global tide gauges show moderate mean rates
– many key sites and test sites show little or no rise at all
– nowhere do we find records of true “acceleration”
– satellite altimetry show a mean rise of 0.5 ±0.1 mm/yr after back-calibration
– past sea level oscillations have been faster & steeper than in the last century
Morner explained: “The paper is full of very bad violations of observational facts.” Just one example:
This is their graph of sea level change at Christmas Island, Kiribati:

This is the tide gauge record from Christmas Island:

Morner asked: “How can anyone find a rapidly rising trend in this tide gauge record? It is flat or rather slowly falling – but in no way rising.”
“So they work – with no respect to observational facts. A true case for Fraud Investigation,” Morner added.
SOURCE
Morner didn't comment on it but Kopp's combining the Christmas Island and the Kiribati record is yet more of his weirdness. The two places are in different oceans thousands of miles apart
Posted by John J. Ray (M.A.; Ph.D.).
Tuesday, February 23, 2016
What a childish mind! Michael Mann's scientific conclusions were changed by pretty pictures
Michael Mann has just given an interview in which he says his belief in global warming arose when he saw temperature differences represented in color. The numbers had not influenced him until that point. See below. To us real scientists, the numbers are everything but not to the 4-year-old mind of Michael Mann.
So what could cause an adult mind to be so childish? I am a psychologist so I should be able to ansewer that, right? Right. I can. It's a matter of salience. When you are dealing with global 20th century temperature records, the numbers are completely salient. You can't dodge anything about them. And the most obvious thing about them is how uniform they are. They differ only by tenths of one degree Celsius. They show that we live in an era of exceptional temperature stability
But when you display the tiny differences as colors, what you see are relativities rather than absolutes. The absolute magnitude of the differences is no longer salient. It fades into the background. The colors treat as significant differences that are in fact tiny. The colors do no doubt have a numerical code to go with them but that is only a minor detail of what you see. Mann wanted to believe so all that had to happen was for small differences to be represented as dramatic ones. Pathetic!
I am rather amazed that he admitted as much. He must have been lulled into a false sense of security by an interviewer treating him as a hero
Mann’s PhD examined the natural variation in climate to establish whether this might be at least a partial cause of recent global warming. “So I went into climate research more from the standpoint of somebody who was more on the sceptical side. Some of my early work was actually celebrated by climate change deniers,” he explains.
But then something changed his mind.
Mann started doing research with Saltzman and another of the professor’s former students. This was Robert Oglesby, a postdoctoral researcher who is now with the University of Nebraska working on general circulation modelling (GCM).
Colour Maps
The scientists had privileged access to the very latest technology—including modelling software and even a colour printer.
“This was in the early days of computer printers. So to get a colour printout you had to get special paper, and you would go up to the third floor to the special colour printer, so there was a certain drama. Until you printed it out in colour on paper you couldn’t really appreciate the results.”
They printed out world maps which had been colour-coded to show the rise in temperatures for each of the decades, moving through light yellows for little change to reds for the occasional spot where there had been a significant rise.
These maps are now ubiquitous in climate research and reporting, but this was the first time Mann had produced or even seen one like this.
Discernible Influence
“We were just looking decade by decade where there’s been maps of temperatures: 1900, 1910s, 20s, 30s, all the way to the 70s. And if you compare the 70s map to the 1900s map, there isn’t much of a difference,” Mann remembers.
“But once you get to the 1980s, it's like 'bam!' The map turns bright yellow and red. It was in that moment that I actually think that all of us, including Barry I think, crossed over into weighing more on the side that there is a discernible human influence on climate. This is before the IPCC reached that conclusion in 1995 with the publication of the second assessment report.”
In a single moment, Mann abandoned his scepticism about the reality of human-caused climate change. As it happens, he would dedicate the rest of his working life to understanding the true scientific meaning and implications of those red smudges on an early colour printout.
There were three scientists in the room that day. No politicians, no ideologues, no closet Communists tampering with the ink cartridges.
Science-Led
Mann points out: “The important thing to understand there is that our views on this issue were led by the science we were doing, which is the way it should be. The science that we were doing was not influenced by our views on the climate change issue.”
The colour maps formed part of Mann’s first climate change publication, with colleagues, in a peer-reviewed paper. He then set about trying to place modern climate change in a larger context.
What he found, and what he wrote, would throw him headfirst into a sometimes vicious and soul-destroying battle with the climate sceptics who had previously celebrated his work.
Next time, we look at how the dynamic Professor Bob Watson became chairman of the IPCC in 1997 amidst a groundswell of political activity.
SOURCE
Posted by John J. Ray (M.A.; Ph.D.).
Monday, February 22, 2016
Warmist Phil is back! And all warmed up by January

I always enjoy Phil Plait's evasions but he is getting cleverer about them.
The NOAA/NASA figures show that January was unusually hot globally. Accepting that as true and not just another "fiddle", the interesting question becomes what caused it. Phil of course thinks it is all due to CO2 in the air. But there are other explanations and Phil cannily mentions both the major ones in order to discount them: The influence of El Nino and the extraordinary warming in the Arctic.
But he gives no reasons for discounting them. He quotes Gavin Schmidt saying that El Nino had only a minor effect but that is just a guess on Schmidt's part. There's no way of proving it. After the previous El Nino there was a big temperasture fall in the subsequent year. That surely indicates that an El Nino has a BIG effect.
And I have already said something about the Arctic yesterday. Temperatures there are so different that they clearly march to a different drummer and should therefore be adjusted out of the global figures. The Arctic is big and its temperatures were extraordinarily high so adjusting it out would knock the global average temperature down substantially.
But, finally, the killer for Phil: Cape Grim levels of CO2 have not yet been released for January 2016 but they are available for the previous 4 months of 2015. And they are remarkably flat, hovering around 398 ppm. So, contrary to Phil, the big changes he describes CANNOT be due to CO2 -- as CO2 levels show no such change.
How frustrating for Warmists: When CO2 levels were going up, temperature wasn't and now that temperatures are going up, CO2 levels aren't. Pretty poor synchrony for an alleged causal relationship. Warmists can't take a trick.
Hot enough for ya? It should be: January 2016 was the hottest January globally since records began in 1880. And it didn’t just edge out the previous record holder for January, it destroyed it.
The temperatures used here are land and ocean measurements analyzed by the NASA Goddard Institute for Space Studies, using NOAA temperature measuring stations across the world. These are extremely high quality and reliable datasets of global temperature measurements—despite the fallacious cries of a few.
If you want to see how temperatures have changed over time, it’s useful to compare them to an average over some time period. GISS uses the dates 1951–1980; it takes all the temperatures over that range for a given month, averages them, then subtracts that number from the average temperature measured for a given month. This forces the monthly range of 1951–1980 to give an average equal to 0, which is used as the baseline. You can then easily read off how much monthly temperatures deviate from that average, which is called the temperature anomaly; if a month is colder than usual for that month in the data, that shows up as a negative anomaly. If it’s warmer, the anomaly is positive.
The global temperature anomaly for January 2016 was 1.13° Celsius. That makes it the hottest January on record (the previous record was 0.95° C in 2007). But there’s more: 1.13° is the largest anomaly for any month since records began in 1880. There have only been monthly anomalies greater than 1°C three times before in recorded history, and those three were all from last year. The farther back in the past you go, the lower the anomalies are on average.
Yes, the world is getting hotter.
On the blog Hot Whopper (and on ThinkProgress) it’s shown that a lot of January’s anomaly is due to the Artic heating up far, far more than usual, as it has been doing for some time. The temperature map at the top of this post makes that clear.
Look at how much warmer the Arctic is! Not surprisingly, Arctic sea ice was at a record low extent in January 2016 as well, more than 1 million square kilometers lower than the 1981–2010 average. But almost the whole planet was far hotter in January 2016 than the 1951–1980 average.
A lot of deniers will say this is a statistical fluctuation; sometimes things are just hotter. That is utter baloney. If that were true, you’d expect just as many record cold days/months/years as warm ones. Two Australian scientists looked into this and found record hot and cold days were about even … until the 1960s, then hot days started outpacing cold ones, and from 2000 to 2014 record heat outnumbered record cold by a factor of 12 to 1.
As it happens, we’re in the middle of an El Niño, an event in the Pacific Ocean that tends to warm surface temperatures. This is also one of if not the most intense on record. Some of that record-breaking heat in January is due to El Niño for sure, but not all or even a majority of it. As I pointed out recently, climate scientist Gavin Schmidt showed that El Niño only accounts for a fraction of a degree of this heating. Even accounting for El Niño years, things are getting hotter.
The root cause is not El Niño. It’s us. We’ve been pumping tens of billions of tons of CO2 into the air every year for decades. That gas has trapped the Earth’s heat, and the planet is warming up.
Several of the months in 2015 were the hottest on record, leading to 2015 overall being the hottest year ever recorded (again, despite the ridiculously transparent claims of deniers). Will 2016 beat it? We can’t say for sure yet, but judging from January, I wouldn’t bet against it.
SOURCE
Posted by John J. Ray (M.A.; Ph.D.).
Sunday, February 21, 2016
Bureaucracy and canned tomatoes

I initially thought this story was too trivial to be worth mentioning but it is such an hilarious example of bureaucracy in action that I thought I should mention it after all. The story concerns Australia but the lessons about bureaucracy are universal.
I first noticed the story because I do buy canned tomatoes. I tip a can of them into my crockpot as the first step towards making a curry. And I had noticed the odd price disparity between different brands. The "Home" brand I buy from Woolworths costs me only 59c whereas other brands cost as much as $1.40 per can. And the 59c cans come all the way from Italy -- something I have mentioned before.
And the first sentence from the Fairfax news report below is misleading. The bureaucracy has indeed laboured mightily but the assertion that "The days of cheap tinned tomatoes are over" is nonsense. The duties recently imposed range between 4% and 8% and they will be levied on the wholesale price. So say Woolworths buy my 59c can for 50c (it's probably less). So Woolworths will now have to pay how much extra to put that can on their shelves? 4c. So now I will have to pay about 65c for my tomatoes. Why bother? A 65c can of Italian tomatoes is still going to be hugely competitive with a $1.40 can of Australian-grown tomatoes. I can't see the price rise influencing any purchasing decisions at all.
So how come the bureaucracy has laboured and brought forth a nullity? Because it is a rule-following organism. The duty imposed was a dumping duty -- meaning the Italians sell their product for export at a lower prices than they charge local Italian shopkeepers. They do it because they still have some profit at the lower price and some profit is better than none. It keeps their volumes and market share up.
And dumping duty is calculated according to strict rules. You subtract the price to Australia from the price to Italy and express it as a percentage. You then add that percentage to the Australian price in the form of an import duty. So, as it happened, the Italian canners were selling us their tomatoes only a touch more cheaply than they charge Italian customers. The export discount was minor so the dumping duty was minor. A bureaucrat with a brain would have said "This is not worth bothering about". But a bureaucrat is not paid to think. He is paid to follow rules. And our lot did exactly that.
But that is not the only absurdity. The big market for tomatoes is for fresh tomatoes. As little as 2% of Australian-grown tomatoes end up in cans. So if Italian canned tomatoes took over completely, it would make no important difference to Australian tomato farming. The growers would continue growing as before. The main existing canners are owned by Coca Cola so sympathy for them is probably not large -- and they can lots of other fruit so their production lines would not be likely to lie idle.
So we see yet again why conservatives dislike bureaucracy and why Leftists love it. Leftists hate the society they live in so much that imposing anything inefficient, costly and wasteful on their society seems great to them.
And it is bureaucracy that created the problem in the first place -- the EU bureaucracy. EU farmers -- particularly French ones -- are prone to huge tantrums if they are not making enough money. They blockade things, burn things and generally create havoc. So to placate them, the EU bureaucracy pays them big subsidies. That 50c can of tomatoes probably cost $1 to produce -- with the EU taxpayer supplying the other 50c
Ain't government wonderful?
The days of cheap tinned tomatoes are over, with the federal government backing a decision to slap anti-dumping measures on two Italian giants that account for half of imported tinned tomatoes in Australia.
The Anti-Dumping Commission found exporters La Doria and Feger di Gerardo Ferraioli guilty of dumping - selling product for less than they sell for in their own country - and causing "material damage" to the local industry.
Industry Minister Christopher Pyne said the government would impose dumping duties on the two players: 8.4 per cent to Feger tomato products and 4.5 per cent to La Doria imports.
"This ruling will ensure that Australia's only canned tomato producer, SPC Ardmona, can now compete equally in Australian stores and supermarkets," he said.
The decision means all 105 canned tomato exporters from Italy will now be affected by dumping duties. An earlier ruling saw Feger and La Doria escape penalty for dumping.
With the price of a 400 gram tin of Italian tomatoes as low as 60 cents on shelves, consumers should expect overall prices to rise. A similar SPC tin is $1.40.
But Coca-Cola Amatil-owned SPC, which has suffered a loss of 40 per cent of volume and reduced profitability during its fight, urged consumers to consider "the quality, value, ethics and food miles" of Australian-grown products.
"This is a win for SPC and our growers, and for Australian industry, which faces daily pressure to compete with cheap imports and those cutting corners and putting slavery in a can," said SPC's managing director Reg Weine.
SOURCE
Mr Weine's "slavery in a can" remark refers to claims that Italian growers use poorly paid illegal immigrants from Muslim lands to do much of their harvesting. They probably do. Americans would understand
Posted by John J. Ray (M.A.; Ph.D.).
Saturday, February 20, 2016
1 Peter chapter 1:3-5
I went to a Presbyterian funeral on Friday and the text for the sermon was as above. I should not have been surprised but I WAS rather surprised to note that the minister completely ignored what the text actually said. He just saw in it what he wanted to see. Here it is (RSV):
"Blessed be the God and Father of our Lord Jesus Christ! By his great mercy we have been born anew to a living hope through the resurrection of Jesus Christ from the dead, and to an inheritance which is imperishable, undefiled, and unfading, kept in heaven for you, who by God's power are guarded through faith for a salvation ready to be revealed in the last time"
The first sentence is an explicit contradiction of the pagan Mumbo-Jumbo known as the Trinity doctrine -- a doctrine accepted by most Christian churches, including Presbyterians. The Trinity doctrine says Jesus is God and yet we have Peter plainly denying that -- in saying that God is the father of Jesus. And yet the minister saw no issue in the text. I will not grumble further about Trinity theology as I have done so often before (e.g. here and here).
And then there is the issue of who goes to heaven and when. The minister was sure that the deceased was in heaven already but Peter spoke not of Christians going to heaven but rather of Christians having an inheritance which is "KEPT in heaven" and that actual salvation occurs "in the last time" -- the "last trump" (not Donald), as the Apostle Paul has it in 1 Corinthians 15:52 -- when the dead are raised at the second coming of Christ. And the minister missed that issue too. Does anybody actually LISTEN to what the Bible says these days? A lot of clergy clearly do not.
I have carefully not identified the minister and his church as he is clearly just conforming to the traditions of his denomination and probably means well
Posted by John J. Ray (M.A.; Ph.D.).
Friday, February 19, 2016
Georgia Woman Admits Sex with Teen

(St. Marys, Georgia) A 27-year-old local woman, Kristeen Harden, has been indicted for statutory rape of a 14-year-old boy.
Harden admitted to having sex with the teen inside her home.
Thursday, February 18, 2016
Millions Reportedly Found

(New South Wales, Australia)
A NSW man might be about to wipe out his mortgage in one fell swoop, if a sensational claim he made about finding millions of dollars in cash and gold bullion in the wall of his newly-purchased house is true.OK
Speaking to Merrick Watts on Triple M earlier this week, "Dave" told the ebullient radio host he had uncovered the mother lode while renovating.
"Between the walls there are is bunch of money," Dave said. "Stacks and stacks of money – and gold bars."
"Have you counted the currency?" Watts asked.
"Yes I have," Dave said. "Between one to three million dollars."
"Jackpot!" Watts cried.
"There are about 50 gold bars, I estimate about half a kilo each," Dave continued. "And lots and lots of money here."
Wisconsin Woman Faces Child Sex Charges

(Stoughton, Wisconsin)
According to court records, Kristi Sorenson assaulted the teenager Jan. 23 while the girl was visiting Sorenson’s home on the 2800 block of Aaker Road, in the Town of Dunkirk. The victim reported the attack to authorities five days later.Sorenson is a naughty woman.
After an evening of “continued drinking,” Sorenson was “wasted,” the victim told an interviewer with Safe Harbor Children’s Advocacy Center, when Sorensen began heading towards the bed. After Sorensen fell twice, the girl helped Sorenson get into her bed and left the room, but returned later when she heard a thud, according to the complaint.
The victim told the interviewer she returned to find Sorenson had awoken and was upset about an ex-boyfriend. When the girl attempted to console Sorenson, the 48-year-old began kissing the girl before pinning her to the bed and performing sexual acts, the complaint states.
Russian Smoking Poster

(Moscow, Russia)
A Moscow advert declaring that “smoking kills more people than Obama” has gone viral, becoming the latest in a string of actions condemning the US president as a mass killer.OK
Dmitry Gudkov, the sole liberal opposition MP in Russia’s parliament, on Tuesday posted a photograph of the large poster, which was in a metal-and-glass frame at a bus shelter on Moscow’s third ring road.
“Smoking kills more people than Obama, although he kills lots and lots of people,” the poster read, showing an illustration of the president smoking the last dregs of a cigarette. “Don’t smoke, don’t be like Obama.”
Global Warming’s Personal Health Threat (?)
It had to happen: Now the Zika virus is caused by global warming. Since there has been no warming for over 18 years that is simply a lie. And if warming does resume and tropical diseases move poleward that will be no great problem. I grew up in the tropics so I can assure one and all that proper public health measures make life in the tropics no more onerous than anywhere else. But I grew up in an advanced country. Backward tropical countries are a different kettle of fish -- not to be generalized from
When you think of the planet warming up, what are the primary threats you perceive? Rising seas? More hurricanes and tornadoes? Mass extinction of species? Those are the events many people would likely dismiss, especially if they don’t live too close to the sea or in a hurricane or tornado zone.
Partly because I cover the biotech world, when I think of global warming, I think of personal health risks — real risks to me and my family.
As the planet warms, more people who live in temperate climates like the United States are going to get sick — a lot more people. Extreme heat waves in summer will kill more people. Air pollution and temperature inversions will sicken many more people. Cases of asthma and allergies will rise. Droughts will diminish the food supply. We’ll literally run out of drinking water in certain areas. Algae blooms will make seafood poisonous. Floods will wash away houses where floods have never happened before.
The biggest danger to Americans from warming trends is easily missed — a tiny insect that’s really tough to control. The mosquito can bring us yellow fever, malaria, dengue, chikungunya and other diseases that have been rare in the United States. And make no mistake — these diseases are coming our way sooner rather than later.
The mosquito can bring us yellow fever, malaria, dengue, chikungunya and other diseases that have been rare in the United States. And make no mistake — these diseases are coming our way sooner rather than later.
So when the mosquito-vectored Zika virus showed up in Texas last month, I wasn’t surprised. Since then, we’ve seen something of a panic, with governors of states declaring health emergencies and calling for the Olympics in Brazil to be canceled. The World Health Organization has declared the virus to be an international health emergency. Men who have the virus — or who have had it — are now supposed to use a condom when having sex with pregnant partners, says the Centers for Disease Control. Whether a woman can pass the virus to a man sexually is unknown. A lot is unknown about the virus.
The potential results of a pregnant woman getting the virus may obviously be devastating to the fetus, yet the virus itself is only a mild health threat to the person who gets it. About 80% of people who get the Zika virus don’t even know they have it, although the disease can cause rashes, pinkeye, fevers, joint pains and conjunctivitis. There is no treatment because we have few effective antiviral medications. There is also no proof, other than circumstantial and epidemiological, that the virus actually does cause smaller heads and brain damage to fetuses — microcephaly.
Several types of mosquitoes in the United States can carry Zika, as well as yellow fever, dengue, chikungunya and malaria. Those diseases, largely unheard of in this country in recent decades, are likely to make a significant resurgence in America’s south. Because Zika is similar to diseases like dengue, a vaccine for it was already in the works and is likely to be developed within two years, says Anthony Fauci, director of the National Institute of Allergy and Infectious Diseases.
But the Indians may have beaten the Americans to it. A company in Hyderabad, India, claims to have developed a vaccine for the Zika virus and to have filed a patent application for it nine months ago. The vaccine has not been put through human trials yet.
Meanwhile, prepare yourself for more tropical diseases to make their way north into the United States.
SOURCE
Posted by John J. Ray (M.A.; Ph.D.).
Wednesday, February 17, 2016
A case study in Leftist stupidity and refusal to learn -- the "stolen generation" myth in Australia
On very shallow grounds, many Australian Leftist historians have alleged that 1930s social workers took black (Aboriginal) children from their families willy-nilly and forcibly adopted them into white families in order to make them more like whites. The allegation suits the Leftist tendency to see "racism" under every bed.
Australia is a very tolerant, laid back country that has been absorbing people from many cultures for a couple of hundred years but Leftists are determined to find that Australians are racist -- and the "stolen generation" myth serves that purpose. That the social workers concerned were do-gooder predecessors of today's Leftists doesn't seem to register.
Note the word "generation". That implies thousands. But at most one or two dubious removals have been identified. Only endangered children were removed -- for their own safety -- as various official enquiries in modern times have found.
So how did Leftist historians get it so wrong? By committing a characteristic Leftist mistake: Thinking things were simpler than they were. In particular, they committed a mistake well known to psychologists: Mistaking attitudes for actions.
Psychologists themselves fall into that mistake at times. The most hilarious example of that happens when psychologists purport to study the psychology of conservatism -- aiming to disparage it, of course. They produce sets of statements -- "scales" -- which they believe typify conservative thought and then correlate agreement with them to all sorts of maladjustment. And when they find a correlation they think they have proved that conservatives are a sick lot.
One problem: The scales fail to predict vote for conservative political candidates in national elections. From Adorno, through McClosky to Altemeyer, their lists of "conservative" attitudes do not predict conservative actions. Which shows you how little Leftists know about conservatism -- or anything else much for that matter.
The best known example of an attitude-behavior gap in fact comes from the era of the allegedly "stolen" generation. In the 1930s LaPiere asked restaurateurs if they would serve a minority person. Most said No. So LaPiere sent minorities into the restaurants of the Naysayers and found that they almost all were served without demur. The restaurateurs' attitudes and actions usually did not match.
Why? Because of practical difficulties, mostly. Tossing someone out of your restaurant would create an unpleasant scene which was best avoided.
And a similar thing happened among Australian social workers of the 1930s. Like most people in that era (and indeed today) the social workers saw Aborigines as a sad lot and wished to improve their situation. And a solution that occurred to some of them was to remove all black children from their families and have them brought up by whites in white adoptive families. They failed to grasp how profound are the differences between Aborigines and whites. You are still not allowed to see that, of course.
And the reason why they did not implement that policy was that it was both difficult and mostly illegal. So it was only when the safety of a black child was threatened that they used their social-work powers to remove that child from its family. Given the high rate of dysfunction in black families, however, the only reasonably available adoptive families were often white. And thus the myth of "stolen" children arose among incautious Leftist historians. Caution is in short supply among Leftists generally.
The myth persists among Australian Leftists to this day and it is such a pernicious myth that social workers are often now afraid to remove endangered Aboriginal children from dysfunctional families. It's a myth that kills black kids: Another bad effect of Leftism.
For a systematic debunking of the myth, see historian Keith Windschuttle's magisterial tome "The Fabrication of Aboriginal History, Volume Three, The Stolen Generations 1881-2008". For more concise treatments of the topic see here and here and here (scroll down)
Posted by John J. Ray (M.A.; Ph.D.).
Tuesday, February 16, 2016
Staten Island Stabbings

(New York)
Police on Saturday arrested a fugitive suspected of stabbing his girlfriend and all three of her small children with a kitchen knife in a brutal attack at a hotel used as homeless housing, ending a four-day manhunt.OK
Michael Sykes was last seen on surveillance footage Wednesday heading to the Staten Island Ferry shortly after the fatal attack, and a call to his mother to say he’d killed his girlfriend and was going to kill himself, police said.
When global warming isn't global
Warmists have cottoned on to the fact that their feared 2 degree temperature rise doesn't sound very fearsome to most people. Most of us experience a temperature range of around 10 degrees in any 24 hour period -- sometimes a lot more. So Warmists now want to say that 2 degrees is only an average and that some places on earth will experience a temperature rise of much more than 2 degrees even if the average is 2 degrees. That is reasonable enough. It's basic statistics. An average implies a range.
Note firstly, however, that their study is of climate EXTREMES only, not of averages. The two are presumably related but to what degree is not pursued. Let's be charitable, however, and assume that what they tell us applies to averages too.
They seem rather lost, however, to explain just why some regions will be hotter. The best they can do is to note that the oceans warm more slowly so an average which includes the oceans will imply land temperatures that are hotter than 2 degrees.
And from that they trot out climate models that purport to study large regions of the earth separately. And they find, for instance, "a 2.2°C warming of extremes around the Mediterranean basin". That doesn't sound too scary, however. So they add: "At 1.5°C we would still see temperature extremes in the Arctic rise by 4.4°C". But how scary is that? Arctic temperatures are way below the freezing point of water so even a 4.4 degree rise would not melt anything. And most Arctic ice is sea ice anyway so melting that would have no effect on the sea level -- as Archimedes showed around 3,000 years ago
But it's all based on modelling and the authors themselves supply in their paper a long list of reasons why it could all be wrong. So their general point is reasonable but any specific temperature projection has to be taken with a large grain of salt
Given their alarmist aims, the projections should in fact probably be taken as maxima. So, in that light, they are rather reassuring about the regional effects of any future global warming
Popular article below followed by the journal abstract
Regions around the Arctic may have passed a 2°C temperature rise as far back as 2000 and, if emissions rates don't change, areas around the Mediterranean, central Brazil and the contiguous United States could see 2°C of warming by 2030.
This is despite the fact that under a business as usual scenario the world is not expected to see global average temperatures rise by 2°C compared to preindustrial times until the 2040s.
New research published in Nature led by Prof Sonia Seneviratne from ETH Zurich with researchers from Australia's ARC Centre of Excellence for Climate System Science (ARCCSS) has quantified the change in regional extremes in a world where global average temperatures have risen by 2°C.
The research shows worldwide warming extremes over land generally exceed the rise in this scenario, in some cases by as much as 6°C. "We even see starkly different rates of extreme warming over land even when global average temperatures reach just 1.5°C, which is the limit to the rate of warming agreed to at the Paris talks," said lead author Prof Seneviratne.
"At 1.5°C we would still see temperature extremes in the Arctic rise by 4.4°C and a 2.2°C warming of extremes around the Mediterranean basin."
The extreme regional warming projected for Alaska, Canada, Northern Europe, Russia and Greenland could have global impacts, accelerating the pace of sea-level rise and increasing the likelihood of methane releases prompted by the melting of ice and permafrost regions.
"The temperature difference between global average temperatures and regional temperature extremes over land not only has direct climate impacts, it also means we may have to reconsider the amount of carbon dioxide we can emit," said co-author and Director of ARCCSS Prof Andy Pitman.
"For instance, to keep extreme temperature changes over the Mediterranean below a 2°C threshold, the cumulative emissions of CO2 would have to be restricted to 600 gigatonnes rather than the 850 gigatonnes currently estimated to keep global average temperatures increase below 2°C."
According to the researchers, if global average temperatures warm by 2°C compared to preindustrial times this would equate to a 3°C warming of hot extremes in the Mediterranean region and between 5.5 -- 8°C warming for cold extremes over land around the Arctic. Most land-masses around the world will see an extreme temperature rise greater than 2°C.
One of the few exceptions is Australia -- famously known as a land of droughts and flooding rains. The projections show little difference between global average temperatures and a change in its extreme regional temperatures.
"This might be something peculiar about Australia's climate, or perhaps it highlights problems with the climate models," said Prof Pitman.
"If the latter, there is a risk Australia will lack warnings about the increases in extremes that are now clearly available to Northern Hemisphere countries."
He said this potential hole in understanding of climate extremes climate needs urgent resolution with more focused model development in the southern hemisphere.
The researchers also note the paper did not take into account unexpected changes in the climate system.
"What this research cannot take into account are abrupt climate shifts known colloquially as "tipping points"," said ARCCSS co-author Dr Markus Donat.
"We have no way of knowing when our climate may change abruptly from one state to another meaning we could potentially see even greater regional variation than these findings show."
SOURCE
Allowable CO2 emissions based on regional and impact-related climate targets
Sonia I. Seneviratne et al.
Abstract
Global temperature targets, such as the widely accepted limit of an increase above pre-industrial temperatures of two degrees Celsius, may fail to communicate the urgency of reducing carbon dioxide (CO2) emissions. The translation of CO2 emissions into regional- and impact-related climate targets could be more powerful because such targets are more directly aligned with individual national interests. We illustrate this approach using regional changes in extreme temperatures and precipitation. These scale robustly with global temperature across scenarios, and thus with cumulative CO2 emissions. This is particularly relevant for changes in regional extreme temperatures on land, which are much greater than changes in the associated global mean.
SOURCE
Posted by John J. Ray (M.A.; Ph.D.).
Monday, February 15, 2016
$20 Million Diamond

(South Africa)
Lucapa Diamond Company found the massive 404-carat diamond at its Lulo Diamond Project in Angola's Lunda Norte province, in the country's north-east.OK
It is the biggest diamond ever found in Angola.
Lucapa chairman Miles Kennedy said it was a huge achievement.
"When we first looked at the property, 3,000 square kilometres of untouched ground, 700 kilometres inland from the coast, you are talking about a very, very remote area," he said.
"The results today are a wonderful vindication of eight years of pretty hard work.
Dutch Open Poop Bank

(The Hague, Netherlands)
After blood and sperm banks, Dutch researchers have now opened the country's first "poop bank" in a rare and cutting-edge branch of medicine to treat people with chronic gut infections.OK
"Our poop bank will help give doctors and hospitals access to transplants of fecal matter," Ed Kuijper, professor of microbiology at Leiden University, told AFP.
The Netherlands Donor Feces Bank (NDFB) will collect, store and distribute the stools necessary to help with such transplants.
Organic farming 'could be key to feeding the world!
Forgive me while I laugh. A lot of "organic" farmers do sneak in some chemical fertilizers and pesticides. When your whole crop is being devoured by some insect, it is hard not to reach for the spray. And Mischa Popoff has shown that they almost all get away with it.
But based on studies that do use organic methods exclusively, it appears that, compared with modern farming, organic farming can take up as much as twice the land to produce the same output. How that could "feed the word" boggles the imagination.
And note that some things that they identify below as organic are in fact routine practice. Crop rotation are as old as the hills, as it the use of legumes to restore soil nitrates. I grew up in a house surrounded by farms and I remember well the fields that were full of apparently useless weedy crops --legumes such as cowpeas. It wasn't visible to me at the time but their associated bacteria were busily grabbing nitrogen from the air and transforming it into nitrate fertilizers.
But the biggest laugh below is that organic crops withstand drought or semi-drought better. And that is supposed to give them the edge in droughts caused by global warming. But global warming will not increase droughts. It will evaporate more moisture off the oceans, which will fall as INCREASED rainfall. The true believers below should revisit basic physics
Organic farming – long held to be irrelevant in tackling world hunger – could be key to feeding the world as global warming takes hold, one of the biggest studies ever to be carried out into the “contentious” practice has concluded.
The research, which has reviewed hundreds of studies stretching back over four decades, not only overturns conventional wisdom but contradicts Britain’s official Food Standards Agency, which has repeatedly attacked chemical-free agriculture. It adds to emerging evidence that it may be more productive and profitable than conventional farming in the long term, especially in developing countries, and says it can provide an “ideal blueprint in addressing climate change”.
Published this month in the leading journal Nature Plants, the study admits that “organic agriculture has a history of being contentious” and is still considered by its many critics as “an inefficient approach to food security and a farming system that will be become less relevant in the future”.
It adds that the practice is regarded as “ideologically driven”, with “many shortcomings”, not least because it “relies on more land to produce the same amount of food as conventional agriculture”, And it quotes a 1970s US Agriculture Secretary, Earl Butz: “Before we go back to organic agriculture in this country, somebody must decide which 50 million Americans we are going to let starve or go hungry”.
Yet, the study – led by Professor John Reganold of Washington State University – goes on, “organic food and beverages” are now “a rapidly growing market segment in the global food industry”. Worldwide sales increased fivefold to US $72bn (£50bn) between 1999 and 2013, and are expected to double again by 2018. The practice is certified in 170 countries and the current US Agriculture Secretary, Tom Vilsack, describes it as “one of the fastest growing segments of American agriculture” driven by “growing consumer demand.”
The research also acknowledges it produces lower yields than chemically driven agriculture, but at 8 –25 per cent, the reductions are less than often supposed. Another mammoth study – at the University of California 14 months ago – found that the deficit could be more than halved by rotating crops and avoiding monocultures: for leguminous produce such as beans, peas and lentils there was no difference at all and overall it could be “a very competitive alternative to industrial agriculture”.
But it is climate change that may give organic farming the edge. As the new research underlines, “organically managed farms have frequently been shown to produce higher yields than their conventional counterparts” during droughts, because the manures they use retain moisture in the soil. And severely dry conditions “are expected to increase with climate change in many areas”.
As other studies have shown, organic fertilisers also increase the amount of carbon in the soil, while intensive agriculture denudes it, increasing erosion and reducing its fertility. Wheat, for example, has traditionally produced much higher yields in conventional than in chemical-free farming, but these have now stagnated for some 20 years after almost tripling during the previous 50 years.
Losses of organic matter from British soil now cost the country £82m a year and the Government admits that this is “not sustainable in the long term”. But it has done little about it: there is not even any countrywide monitoring of soil health.
Organic techniques, moreover, are even more effective in developing countries, where most farmers cannot afford to buy much artificial fertiliser or pesticide. One UN report which looked at 114 projects, involving nearly two million African farms found that they more than doubled yields.
Another, led by the University of Essex – which examined projects in 57 countries, covering three per cent of the Third World’s cultivated area – revealed an average 79 per cent increase.
Chemical-free farming is also more profitable in both developed and developing countries, the new report adds: four decades of studies covering 55 crops grown on five continents found they yielded a 22-35 per cent better return than conventional produce. This was, of course, due to the premium organic producers can charge, but even slashing the price differential several times over would still leave them better off. And they employ more people.
More predictably, the report finds that organic farming is better for nature and wildlife and reduces exposure to toxic pesticides both on the farm and in food. And it adds that 80 per cent of major studies into its nutritional value have suggested that it is better for consumers, contradicting the position of the Food Standards Agency.
It stresses that “no one farming system alone will safely feed the planet”, but calls for “the untapped potential role” of chemical-free agriculture to be realised by blending it with the best practices of its conventional counterpart.
SOURCE
\ Posted by John J. Ray (M.A.; Ph.D.).
Sunday, February 14, 2016
Does the Church of England have any regard for basic justice?
Peter Hitchens writes on the matter below. It's another case from Britain where the uncorroborated words of an accuser will be automatically believed if the accusation is of a sexual nature. Such an odious practice has in recent times led to the to the hounding of many innocent and distinguished men by the British police.
Fortunately for the accused in this case, he was was dead. When the accuser came forward maligning the saintly Bishop Bell, however, the Church of England promptly paid up, without any judicial process. Is it any wonder that the British police don't accept innocence until proven guilty when the Church of England doesn't accept it either?
The deep injustice done to the late Bishop George Bell, publicly pilloried on the basis of unproven abuse charges, continues. This great and saintly man has been robbed of his name and reputation by the Church that ought to treasure him. Instead, it has sparked a Stalinist campaign to erase his memory.
When criticised, its bishops seek (rather revoltingly) to hide behind the anonymous accuser, who of course must be treated with kindness and sympathy. This fails to conceal their own confusion. Today I can reveal that a very senior figure in the Church, involved in the actions that have done so much damage to George Bell’s good name, has written to a complainant: ‘You will note that at no point have I stated that Bishop Bell was guilty.’ This follows a similar statement in the House of Lords by the Bishop of Durham, which I reported last week.
How strange, then, that several newspapers and the BBC have somehow got the idea that he is guilty. Who told or briefed them that this was so?
Lambeth Palace has clumsily tried to unsay the Bishop of Durham’s words, issuing a garbled mass of piffle in his name, in which he appears to contradict himself.
Odd that this happened only after I publicised his speech here. These flapping prelates should not think this matter is anywhere near finished.
SOURCE
Posted by John J. Ray (M.A.; Ph.D.).
Saturday, February 13, 2016
Marijuana Use in Colorado

(Denver, Colorado)
In most states, smoking a joint at work would land you in the unemployment line, but the legalization of marijuana in Colorado has given birth to group of businesses that tolerate and even encourage employees to consume weed.OK
They include Denver-based MassRoots, a tech startup that likes to refer to itself as the Facebook for pot users, which allows its 30 employees to use cannabis as a way to stimulate creativity and boost productivity.
One way MassRoots co-founder Isaac Dietrich does that is by scheduling weekly rooftop smoke sessions (smoking isn't allowed inside the building that houses the company's downtown headquarters), where employees bond and strategize.
Ozone layer holier than ever!
So the Arctic has developed an ozone hole too. And it's a big one. It was the Antarctic hole that triggered the Greenie campaign against refrigerant gases but the logic behind the ban meant that the Arctic should have been protected too. It wasn't. So now that the ban has been in force for many years, we have got a holier ozone layer than ever. The science behind the ozone nonsense has long ago been shown to be mistaken and reality too has now caught up. Greenies hailed the antiozone Montreal protocol as their biggest achievement. But it was as poorly founded as all the rest of the Greenie scares
A huge hole in the ozone layer over the Arctic is set to grow even larger this spring as a blast of cold weather combines with returning sunshine and lingering air pollutants.
The hole over the Canadian Arctic is already thought to be around 770,000 square miles (two million square kilometres) or around the size of Greenland.
But environmental scientists are predicting the gap in the Earth's protective atmospheric layer could grow even larger this spring when the sunshine returns to the region after the long, dark winter.
According to Science magazine, a record low temperature in the Earth's upper atmosphere could release chemicals which destroy the layer.
Ozone is a gas composed of three oxygen molecules which can be hazardous to our health on the ground, but in the upper atmosphere it protects us by soaking up ultraviolet radiation from the sun.
Without it, the planet's surface would be exposed to dangerous levels of UV-B rays which can shred DNA, leading to mutations that cause cancers.
Towards the end of the 20th Century, the ozone was found to have been depleted by the now banned chlorofluorocarbons (CFCs), which react with the ozone as they break down.
The extent of the hole above Canada was revealed in 2011. In extended cold periods, like the Arctic winter, the hole can become enlarged.
Dr Markus Rex, an atmospheric chemist at the Alfred Wegener Institute (AWI) in Germany explained that by next week as much as a quarter of the Arctic's ozone will be destroyed.
Ozone is constantly replenished in the atmosphere but if the rate of destruction outstrips this then the hole can enlarge.
Scientists warn that if this year's polar vortex – the wintry weather pattern which traps circulating cold air in the upper atmosphere – continues longer than usual into the spring, the returning sunlight could set off a chemical chain reaction widening the hole even further.
Dr Markus Rex, an atmospheric chemist at the Alfred Wegener Institute (AWI) in Potsdam, Germany explained that by next week as much as a quarter of the Arctic's ozone could be destroyed.
'Should the vortex persist until well into March, the formation of a deep ozone minimum over the Arctic has to be expected,' said Dr Rex.
He added: 'However, if the vortex breaks up before then, the air masses will sufficiently mix with fresh air from lower latitudes and the Arctic will narrowly avoid a new record of ozone depletion.'
The team at the AWI say that the while they are unable to accurately predict the fate of the vortex, and if it will break up before spring returns, the researchers say that there is a chance that a hole in the layer – or 'ozone minimum' – could even drift over central Europe.
The scientists are continuing to monitor the atmosphere closely and releasing weather balloons from a number of stations dotted throughout the Arctic.
SOURCE
Posted by John J. Ray (M.A.; Ph.D.).
Friday, February 12, 2016
Ted Nugent Replies to Critics

Ted Nugent's Facebook post features Israeli flags on a collage of the faces of 12 prominent Jewish Americans, and asks, "So who is really behind gun control?"OK
Thousands shared Nugent's Feb. 8 post that calls those pictured, former U.S. Senator Carl Levin among them, "punks" and says "they hate freedom."
In another post, Nugent described Jews killed by the Nazi regime as "soulless sheep to slaughter."
Thursday, February 11, 2016
Webcam on Utility Pole

(Tennessee Rural Farm)
A federal appeals court is upholding the firearms conviction of a Tennessee man whose brother's rural farm was monitored for 10 weeks straight by a remote-controlled camera the authorities installed on a utility pole 200 yards away—without a warrant.OK
The decision (PDF) by the 6th US Circuit Court of Appeals affirms the nine-year sentence of a man named Rocky Houston, who was caught by the camera as being a felon in possession of a gun. The man was on a Roane County Sheriff's Office watch list after he was cleared of murder charges following a gun battle that left a Roane County law enforcement official dead in 2006.
"There is no Fourth Amendment violation, because Houston had no reasonable expectation of privacy in video footage recorded by a camera that was located on top of a public utility pole and that captured the same views enjoyed by passersby on public roads," Judge John Rogers wrote for the unanimous court, which ruled 3-0 to uphold Houston's 2014 conviction.
Shopping While Drinking

(Canton Township, Michigan)
An expanding southeast Michigan grocery chain is looking to start a new concept in its stores by turning to by-the-glass beer and wine sales so that customers can drink during a shopping trip.OK
Busch's Fresh Food Market is seeking a Class C liquor license for the store it plans to open in Canton Township, west of Detroit.
That store would mark Busch's first foray into setting up an in-store 'bistro' with beer and wine sales for customers.
"It will allow guests to walk through the store and let them drink alcohol while they're shopping," said John Hunter, director of marketing for the Ann Arbor-based, 15-store chain.
The record year 2015 and what helped
Below is just a machine translation from the German of Frank Bosse und Fritz Vahrenholt. I didn't feel like tidying it up as I think the messages get through anyway. They note that 2015 officially was thirteen hundredths of a degree warmer than 2014 and ask why. They make the obvious point that El Nino was a big contributor but what I think is of particular interest is their attack on the retrospective and controversial "adjustments" to ocean temperature by Tom Karl -- adjustments that wiped out the "pause".
Bosse and Vahrenholt below use the Argo floats to test the changes. They find that for the period covered by the Argo floats, the "old" temperature statistics match the Argo record better than did Tom Karl's adjusted statistics. Since the Argo floats provide the best ocean temperature record by far, it is clear that Karl's adjustments are not validated. The "old" measurements are the best and the "pause" is back!
The last sentence below is also very interesting. The entire terrestrial record may by now be too corrupt for any reliance to be placed on it
The 2015 ended with a record: The temperature range GISS recorded +0.87 ° C anomaly compared to the reference period 1951-1981. These were further 0.13° C was observed over the previous year in 2014 globally. They rose strongly on ocean temperatures. A look back at a few months earlier record GISS of May 2015 shows that the global mean temperatures were 2014 then still appear lower by 0.06 ° C than in January 2016.
How can that be? In summer 2015, a correction of ocean temperatures was introduced, we had, among other things here reported. The trigger: The measurement methods for detecting the surface temperatures of the oceans (SST Sea Surface Temperature) changed from 1998. Whereas previously the SST determined from ships, often by the water temperature was measured in buckets or the sucked cooling water, you went to later precise measurements over buoys. This transition was, according to the scientists to T. Karl. By NOAA, a negative distortion, which is minimized (for obvious to warm measurements of the past down to the precise measurements of the presence of upward) with corrections This measure was taken very quickly for the global soil temperature series.
We want to assess the validity of the corrections by T. Karl shortly. As a reference, we use the most homogenous temperature range that is available for sea surface temperatures: The buoy measurements of the Argo program , which since 2004 provides fairly accurate and closely defined data error. We consider the temperatures of the upper 100m globally and comparing the uncorrected series ERSSTv3b and the realigned series ERSSTv4 (NOAA).
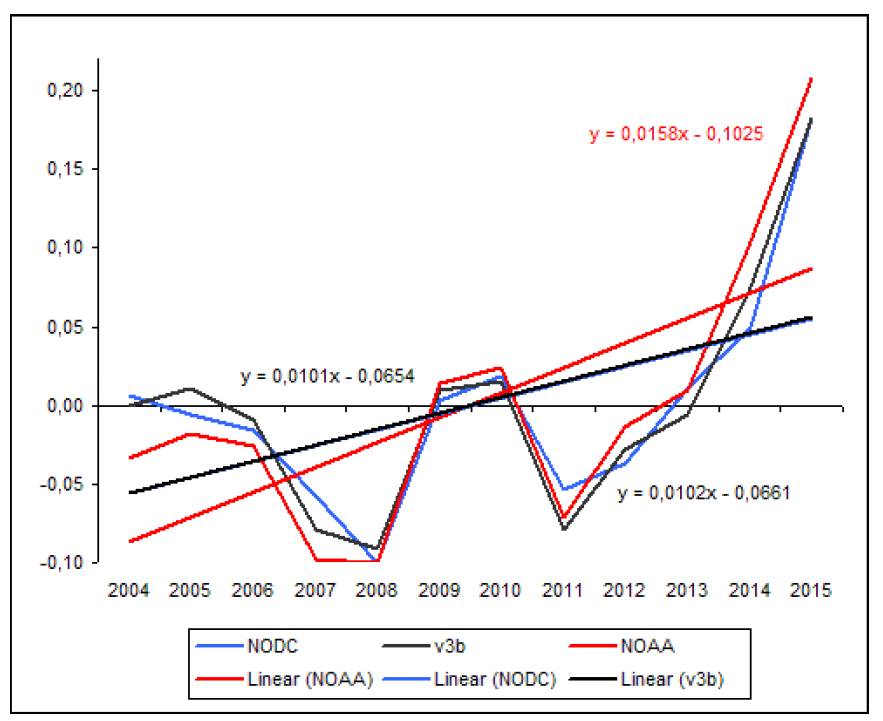
Figure 3: The annual mean SST for ERSSTv3b (v3b- black) and ERSStv4 (NOAA red) and the reference of Argo measurements (NODC- blue) with the resulting linear trend of global SST.
It is striking that the trends for the unadjusted series (black) and for very precise reference number of the buoys measurements (blue) are virtually indistinguishable, the adjusted series (red) but provides a stronger by about 50% rising trend since of 2004. The difference is caused by lower values in the past, and slightly higher in the present. The comparison with the most modern and authentic data on sea temperatures in any case does not justify the correction of the SST by T. Karl. To record in 2015 was the introduction of the new SST-series at about 0.04 ° C.......
Moreover, the satellite measurements of the troposphere show no record increase: both series of measurements, both UAH and RSS, enter 2015 just as the third warmest year since 1979. That the troposphere temperatures rise more slowly than soil temperatures is a state of affairs that does not reproduce the climate models. You expect it the other way around.
More HERE
Posted by John J. Ray (M.A.; Ph.D.).
Wednesday, February 10, 2016
Obama Climate Plan Stalled

President Barack Obama's plans to regulate emissions of carbon dioxide from US power plants have been stalled by the US Supreme Court.OK
The court ruled that the president's Clean Power Plan could not go forward until all legal challenges were heard.
Designed to cut US emissions by 32% by 2030, the scheme put huge emphasis on a shift to renewable energy.
It formed the key element of the US pledge at UN climate negotiations held in Paris in December last year.
Introduced by the president last August, the plan set carbon reduction goals for each state and it was up to the states themselves to come up with proposals to meet those goals.
California Teacher Accused of Sex with Student

(San Diego, California)
Toni Nicole Sutton, 37, a Spanish teacher and volleyball coach, was arrested Jan. 28 at her school.OK
The investigation into Sutton’s alleged sexual relationship with a minor student began when a parent contacted police about communications between the youth and the unmarried teacher, said San Diego police Lt. Sandra Rapalee-Albrektsen.
Subscribe to:
Posts (Atom)